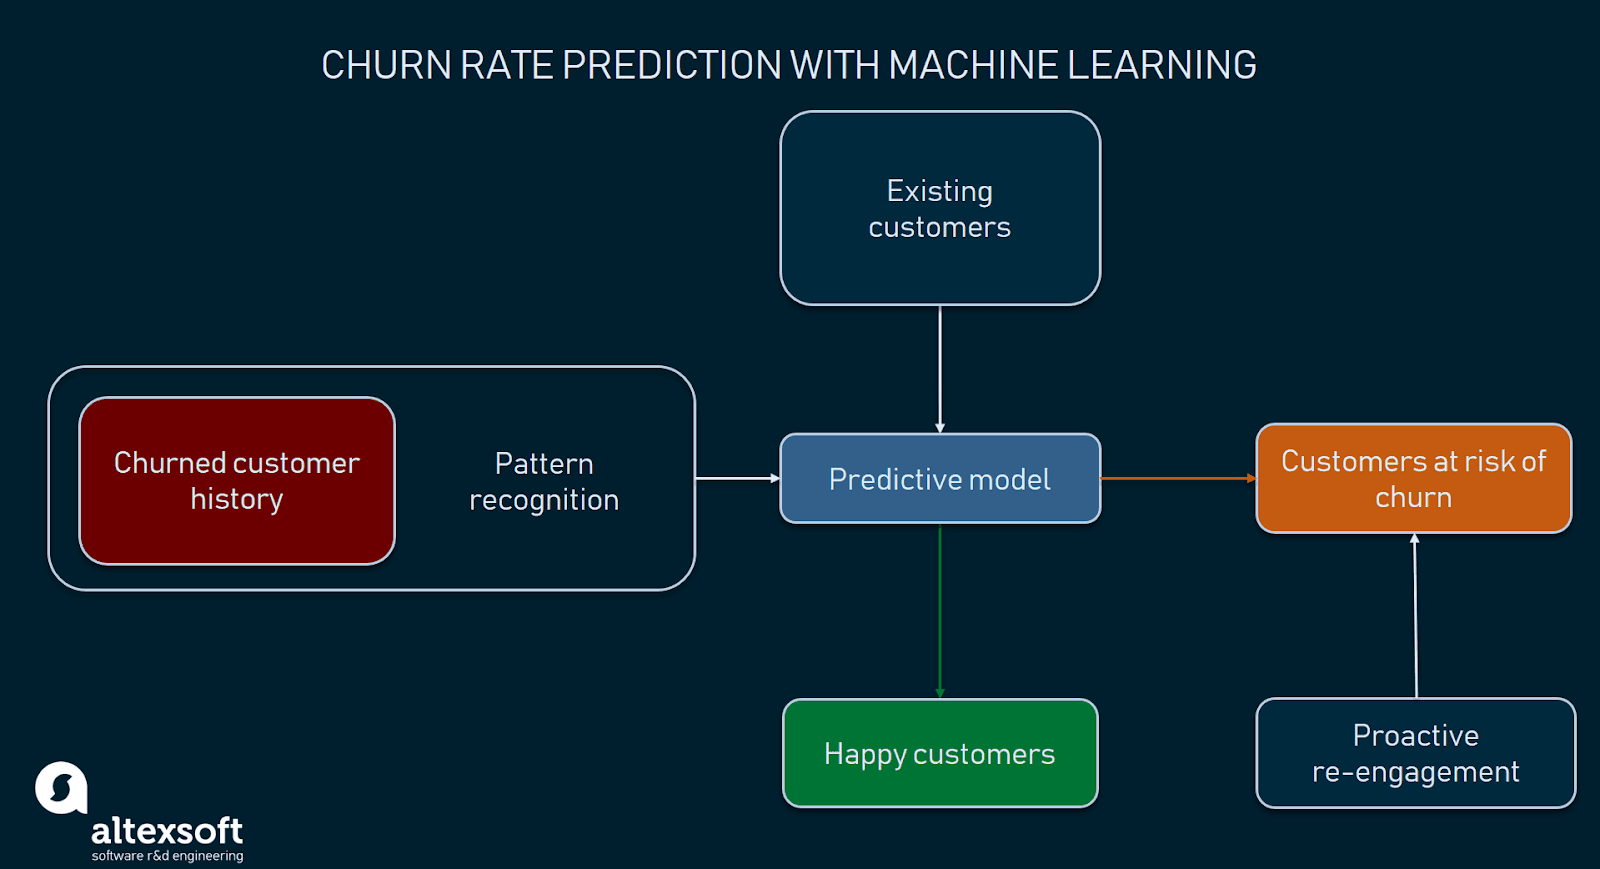
AI-based churn prediction is revolutionizing how businesses understand and retain customers. Predictive modeling, powered by artificial intelligence, moves beyond reactive measures, offering proactive strategies to identify at-risk clients and implement targeted interventions. This allows companies to significantly reduce customer churn, a costly phenomenon impacting profitability and growth. This guide explores the techniques, benefits, and practical applications of this transformative technology.
This exploration delves into the core components of AI-based churn prediction, starting with data collection and preprocessing, moving through model development and training, and concluding with deployment, monitoring, and real-world applications. We’ll examine various AI algorithms, discuss crucial evaluation metrics, and highlight best practices for successful implementation. We aim to provide a clear and comprehensive understanding of this powerful tool for business success.
Introduction to AI-Based Churn Prediction

Customer churn, the rate at which customers stop doing business with a company, is a significant concern for businesses across various sectors. High churn rates directly impact revenue, profitability, and long-term sustainability. Understanding and mitigating churn is crucial for maintaining a healthy and growing customer base.The traditional methods of churn prediction, often relying on basic statistical analysis and rule-based systems, often fall short in accurately identifying at-risk customers.
These methods struggle to handle the complexity and volume of data generated in today’s digital landscape. AI-based churn prediction offers a significant advantage by leveraging advanced algorithms to analyze vast datasets, identify subtle patterns, and provide more accurate predictions. This leads to more effective and targeted interventions to retain valuable customers.
AI Algorithms for Churn Prediction
Several AI algorithms are effectively used for churn prediction, each with its strengths and weaknesses. The choice of algorithm depends on factors like data size, complexity, and the need for interpretability. The following table compares three commonly used algorithms: Logistic Regression, Decision Trees, and Neural Networks.
| Algorithm | Accuracy | Complexity | Interpretability |
|---|---|---|---|
| Logistic Regression | Moderate to High (depending on data quality and feature engineering) | Low | High; easily understandable coefficients and probabilities. |
| Decision Trees | Moderate to High (can be prone to overfitting) | Moderate | Moderate; the decision-making process is relatively easy to visualize and understand. |
| Neural Networks | High (can achieve very high accuracy with sufficient data and tuning) | High | Low; the “black box” nature makes understanding the prediction process challenging. |
For example, a telecommunications company might use logistic regression to identify customers likely to switch providers based on factors like call frequency, data usage, and contract type. A retail company might employ decision trees to segment customers into different risk categories based on purchase history and engagement with marketing campaigns. A financial institution might leverage neural networks to predict customer attrition based on a wider range of transactional and behavioral data, potentially including sentiment analysis from customer service interactions.
The choice of algorithm is a critical step in building an effective churn prediction model.
Data Collection and Preprocessing for Churn Prediction
Accurate churn prediction relies heavily on the quality and completeness of the data used to train the predictive model. Gathering relevant data and preparing it for analysis is a crucial first step, impacting the model’s accuracy and reliability. This section details the essential data points, the data cleaning process, and techniques for enhancing model performance through feature engineering.
Essential Data Points for Churn Prediction
The selection of data points significantly influences the predictive power of the churn model. A comprehensive dataset should include both demographic and behavioral information to capture a holistic view of customer interactions.
- Demographic Data: Age, gender, location, income level (if available).
- Account Information: Account tenure, service plan (e.g., basic, premium), payment method, contract type (e.g., month-to-month, annual).
- Usage Data: Frequency of service usage, data consumption, call minutes, average session duration (depending on the service).
- Customer Service Interactions: Number of support tickets, average resolution time, customer satisfaction scores (CSAT).
- Billing Information: Payment history (late payments, missed payments), outstanding balance.
- Marketing and Promotion Data: Response to marketing campaigns, participation in loyalty programs.
- Churn Label (Target Variable): Indicates whether the customer churned (1) or not (0).
Data Cleaning and Handling Missing Values
Real-world datasets are rarely perfect. Data cleaning addresses inconsistencies, errors, and missing values to ensure data quality.Data cleaning involves several steps:
- Handling Missing Values: Missing values can be addressed through imputation techniques. Simple imputation methods replace missing values with the mean, median, or mode of the respective feature. More sophisticated methods, like K-Nearest Neighbors (KNN) imputation, use the values of similar data points to estimate missing values. For categorical variables, the most frequent category can be used.
- Outlier Detection and Treatment: Outliers, which are data points significantly different from the rest, can skew the model’s results. They can be identified using box plots or scatter plots and handled by removing them, transforming them (e.g., using logarithmic transformation), or capping them at a certain threshold. For example, an unusually high number of support tickets might be an outlier indicating a data entry error.
- Data Transformation: Data transformation techniques, such as standardization (z-score normalization) or min-max scaling, can improve model performance by scaling numerical features to a similar range. This prevents features with larger values from dominating the model.
- Data Consistency Checks: Ensuring consistency in data formats, units, and naming conventions is essential for accurate analysis. This involves correcting inconsistencies and standardizing the data to a common format.
Feature Engineering for Improved Model Performance
Feature engineering involves creating new features from existing ones to improve the predictive capabilities of the model. This step often significantly enhances model accuracy.Examples of feature engineering techniques applied to customer churn data include:
- Creating interaction terms: Combining two or more features to capture their combined effect. For instance, combining “account tenure” and “number of late payments” could create a new feature reflecting the impact of late payments over time.
- Binning numerical features: Grouping continuous variables into categorical bins. For example, customer age can be binned into age groups (e.g., 18-25, 26-35, etc.). This can simplify the model and improve interpretability.
- Encoding categorical features: Transforming categorical variables into numerical representations suitable for machine learning algorithms. Techniques like one-hot encoding or label encoding are commonly used. For example, different service plans (basic, premium, etc.) can be converted into numerical values.
- Creating time-based features: Extracting features from timestamps. For example, “days since last login” or “months since last purchase” can be powerful predictors of churn.
- Aggregating data: Summarizing data over a period. For example, calculating the average monthly data usage or the total number of support tickets over the past year can provide valuable insights.
Model Development and Training

Developing an effective AI-based churn prediction model involves a systematic process of data preparation, model selection, training, and evaluation. The ultimate goal is to build a model that accurately predicts which customers are likely to churn, allowing businesses to proactively intervene and retain them. This section details the crucial steps in this process.
The process begins with choosing an appropriate machine learning algorithm and then carefully preparing the data for training. This includes splitting the data into training, validation, and testing sets to ensure the model generalizes well to unseen data and avoids overfitting. Finally, the model’s performance is rigorously evaluated using various metrics to determine its effectiveness.
Data Splitting for Model Training
Splitting the data into training, validation, and testing sets is a critical step in model development. The training set is used to train the model, the validation set is used to tune hyperparameters and prevent overfitting, and the testing set is used to evaluate the final model’s performance on unseen data. A common approach is an 80/10/10 split, allocating 80% of the data for training, 10% for validation, and 10% for testing.
This ensures sufficient data for each phase while maintaining a representative sample of the overall dataset. Stratified sampling is often employed to maintain the class distribution (proportion of churners and non-churners) across all three sets. For example, if 15% of the customers churned in the original dataset, a stratified split would ensure approximately 15% churners in each of the training, validation, and testing sets.
This prevents bias in the model’s training and evaluation.
Model Evaluation Metrics
Several metrics are used to evaluate the performance of a churn prediction model. The choice of metric depends on the specific business context and the relative costs of false positives (predicting churn when it won’t happen) and false negatives (failing to predict churn when it will happen). Below is a comparison of common metrics:
| Metric | Description | Interpretation | Example |
|---|---|---|---|
| Precision | The proportion of correctly predicted churners out of all predicted churners. | High precision indicates a low rate of false positives. | A precision of 0.8 means that 80% of the customers predicted to churn actually churned. |
| Recall (Sensitivity) | The proportion of correctly predicted churners out of all actual churners. | High recall indicates a low rate of false negatives. | A recall of 0.7 means that the model correctly identified 70% of the customers who actually churned. |
| F1-Score | The harmonic mean of precision and recall. | Provides a balanced measure considering both precision and recall. | An F1-score of 0.75 represents a good balance between precision and recall. |
| AUC (Area Under the ROC Curve) | Measures the model’s ability to distinguish between churners and non-churners across different thresholds. | A higher AUC indicates better discriminatory power; an AUC of 1 represents a perfect classifier. | An AUC of 0.9 suggests the model is highly effective at distinguishing between churners and non-churners. |
Model Deployment and Monitoring: AI-based Churn Prediction
Deploying a trained churn prediction model involves moving it from the development environment to a production setting where it can be used to make real-time predictions on incoming customer data. This process requires careful consideration of scalability, reliability, and integration with existing business systems. Successful deployment ensures the model’s predictions are readily available to inform business decisions.The deployed model’s performance needs continuous monitoring to ensure it maintains accuracy and effectiveness.
Over time, customer behavior can change, rendering the model’s predictions less reliable. Regular monitoring helps identify such shifts and triggers necessary retraining or model updates. This ensures the model remains a valuable tool for proactive customer retention.
Deployment Strategies
Several strategies exist for deploying a churn prediction model. A common approach involves integrating the model into a company’s existing customer relationship management (CRM) system. This allows for real-time predictions as new customer data is entered. Alternatively, the model can be deployed as a standalone application or web service, accessed through an API. The choice depends on factors such as the complexity of the model, the existing IT infrastructure, and the desired level of integration with other systems.
For example, a smaller company might opt for a simpler deployment method, while a larger enterprise may require a more sophisticated, scalable solution.
Model Performance Monitoring and Retraining
Continuous monitoring of the model’s performance is crucial. Key metrics to track include accuracy, precision, recall, and F1-score. These metrics provide insights into the model’s ability to correctly identify at-risk customers and avoid false positives. Regularly comparing these metrics against historical performance benchmarks can highlight any degradation in accuracy. If performance drops below an acceptable threshold, retraining with updated data is necessary.
This retraining process involves incorporating new customer data and potentially refining the model’s parameters to adapt to evolving customer behavior. For instance, a sudden shift in market trends or a new competitor entering the market could necessitate retraining to maintain prediction accuracy.
Integrating the Churn Prediction Model into Business Workflow
Integrating the churn prediction model into a company’s workflow allows for proactive customer engagement. This integration can take many forms, including automated alerts, targeted marketing campaigns, and personalized customer service interactions. The aim is to use the predictions to identify at-risk customers and take timely actions to retain them.
Scenario: Proactive Customer Engagement
Imagine a telecommunications company using a churn prediction model. The model identifies Sarah, a long-time customer, as having a high probability of churning. The system automatically flags her account, and a notification is sent to the customer service team. A customer service representative then proactively contacts Sarah, offering a personalized discount or upgrade tailored to her usage patterns, based on data insights from the model.
This proactive approach might involve offering a bundled service package that addresses Sarah’s specific needs, such as adding international calling minutes or increasing data allowance. By addressing her potential concerns before she decides to switch providers, the company increases the likelihood of retaining Sarah as a valuable customer. The success of this intervention can be measured by tracking whether Sarah remains a customer after the intervention and by comparing her retention rate to customers who were not flagged as at-risk.
This data then feeds back into the model’s monitoring and retraining process, improving its accuracy and effectiveness over time.
Case Studies and Best Practices

This section explores successful applications of AI-based churn prediction across various industries, highlighting the techniques employed, data utilized, and outcomes achieved. We will also examine common challenges in implementation and offer practical solutions, concluding with guidance on interpreting model results and translating them into actionable business strategies.
Successful Implementations of AI-Based Churn Prediction
Several industries have leveraged AI for effective churn prediction. For example, in the telecommunications sector, a major mobile carrier utilized a gradient boosting machine (GBM) model. This model was trained on a vast dataset encompassing customer demographics, billing information, call detail records (CDRs), and customer service interactions. The resulting predictions allowed the company to proactively target at-risk customers with tailored retention offers, resulting in a 15% reduction in churn rate within six months.
In the subscription-based streaming service industry, a leading platform employed a recurrent neural network (RNN) to analyze user viewing habits, subscription history, and engagement metrics. This model identified patterns indicating potential churn and enabled the company to implement personalized content recommendations and targeted promotional campaigns, leading to a 10% improvement in customer retention. Finally, in the e-commerce sector, an online retailer used a logistic regression model trained on purchase history, website activity, and customer support interactions to identify at-risk customers.
This resulted in a 7% decrease in churn through personalized discount offers and improved customer service.
Challenges in Implementing AI-Based Churn Prediction and Their Solutions
Implementing AI-based churn prediction systems presents several challenges. Addressing these is crucial for successful deployment.
- Data Quality and Availability: Insufficient or poor-quality data can significantly impact model accuracy. Solution: Invest in robust data collection and cleaning processes, ensuring data completeness and consistency.
- Model Interpretability: Understanding why a model makes a particular prediction is essential for building trust and taking effective action. Solution: Utilize explainable AI (XAI) techniques, such as SHAP values or LIME, to gain insights into model predictions.
- Model Bias and Fairness: Biased data can lead to unfair or discriminatory predictions. Solution: Carefully examine the data for biases and implement bias mitigation techniques during model development and deployment.
- Computational Resources: Training complex AI models can require significant computational resources. Solution: Leverage cloud computing platforms or optimize model architectures for efficient training.
- Integration with Existing Systems: Integrating a churn prediction model with existing business systems can be complex. Solution: Employ a phased approach to integration, starting with a pilot project and gradually expanding to other areas.
Interpreting Model Results and Translating Them into Actionable Insights
Churn prediction models typically output a probability score indicating the likelihood of a customer churning. These scores can be used to segment customers into different risk categories (e.g., high, medium, low risk). Businesses can then tailor interventions based on these risk categories. For instance, high-risk customers might receive personalized retention offers, while medium-risk customers might be targeted with targeted marketing campaigns.
Low-risk customers may not require any intervention. Regular monitoring of model performance and retraining as needed are crucial for maintaining accuracy and effectiveness. Furthermore, analyzing the features that contribute most strongly to churn predictions can provide valuable insights into the underlying drivers of churn, informing strategic business decisions. For example, if a model consistently identifies low engagement with a specific product feature as a strong predictor of churn, the business might consider improving that feature or providing additional support.
Implementing AI-based churn prediction offers businesses a powerful advantage in the competitive landscape. By leveraging the insights gleaned from predictive modeling, companies can proactively engage with at-risk customers, personalize their offerings, and ultimately improve customer retention. While challenges exist, the potential benefits – increased profitability, stronger customer relationships, and enhanced business efficiency – make AI-based churn prediction a worthwhile investment for any organization seeking to optimize its customer lifecycle management.
FAQ Insights
What types of data are most crucial for accurate churn prediction?
Crucial data includes demographics, purchase history, customer service interactions, website activity, and engagement with marketing campaigns. The specific data points will vary depending on the business and industry.
How often should a churn prediction model be retrained?
Retraining frequency depends on factors like data volume, changes in customer behavior, and model performance degradation. Regular monitoring and evaluation are key to determining the optimal retraining schedule. It could range from weekly to quarterly.
What are the ethical considerations of using AI for churn prediction?
Ethical considerations include ensuring data privacy, avoiding bias in algorithms, and maintaining transparency in how predictions are used. It’s crucial to use data responsibly and avoid discriminatory practices.
Can AI-based churn prediction be applied to all businesses?
While applicable to many businesses, its effectiveness depends on data availability and quality. Businesses with limited customer data might find it challenging to implement effectively.
